How to plot AUC - ROC Curve using Python?
Today let me explain a simple ROC graph and its basic understanding with an example. I am using simple dataset, so that you can play around to test the theory behind it. Let’s apply to classify breast cancer data.
In this example, we are using Classification problem, where you need to classify on breast cancer based some input data.
Working code
Try this in Google Collaborator Lab1, or any Python environment to get started.
from sklearn import svm, datasets
from sklearn import metrics
from sklearn.linear_model import LogisticRegression
from sklearn.model_selection import train_test_split
from sklearn.datasets import load_breast_cancer
import matplotlib.pyplot as plt

# Load Data
breast_cancer = load_breast_cancer()

X = breast_cancer.data
y = breast_cancer.target

# Split the Dataset to Train and Test
X_train, X_test, y_train, y_test = train_test_split(X,y,test_size=0.33, random_state=44)

# Train the Model
clf = LogisticRegression(penalty='l2', C=0.1)
clf.fit(X_train, y_train)
y_pred = clf.predict(X_test)

# Test the model using AOC-ROC Graph
y_pred_proba = clf.predict_proba(X_test)[::,1]
fpr, tpr, _ = metrics.roc_curve(y_test,  y_pred_proba)
auc = metrics.roc_auc_score(y_test, y_pred_proba)
plt.plot(fpr,tpr,label="data 1, auc="+str(auc))
plt.legend(loc=4)
plt.show()
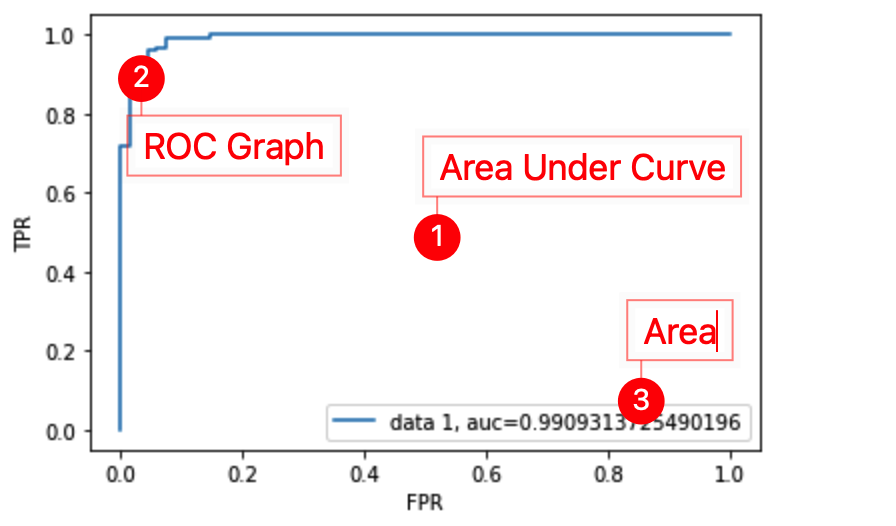
Output - AUROC Graph
TPR - True Positive Rate
True positive, means model predicted Breast Cancer and that is True for entire dataset. What is the TPR ? Mathematically, TPR = TP/TP+FN - it is also known as Recall, if TPR is 1, then for that particular point of time, there were no mistakes done.
TPR=1, if no mistakes made by algorithm. TPR is also knows as Recall/Sensitivity of Model.
FPR - False Positive Rate
Using FPR, we can tell about the accuracy of the model performance. If it is not good, then FPR will almost equal to 1, meaning it says Breast Cancer but in actual case there is no Breast Cancer. Another example, you are not pregnant in actual case, but model says you pregnant.
If it is good model, then FPR should equate to 0, by making Specificity =1, that means, you have developed model which will correctly classifies, great job 🎉
FPR = 1 - Specificity
Combining the TPR and FPR = AUROC
In order to find behavior of model over test data, draw plot and see the Area under Curve value, if it near to 1 means model is fitting right, looks like you got the awesome model. In above code, I am getting Areas as 0.99.., which is a good model using Logistic Regression.
Further Reading
- Confusion Matrix
- Understanding Auc curve
- Simple basic metrics to measure the AI model performance
- Code playground to test the theory…
- Awesome video explanation here
https://colab.research.google.com/drive/1tRR6VatCVmpWZaHFJ47Xtyz3GzUZ1wu2?usp=sharing ↩